Article Text

Abstract
Objective To validate the estimates of Global Burden of Disease (GBD) due to congenital anomaly for Europe by comparing infant mortality data collected by EUROCAT registries with the WHO Mortality Database, and by assessing the significance of stillbirths and terminations of pregnancy for fetal anomaly (TOPFA) in the interpretation of infant mortality statistics.
Design, setting and outcome measures EUROCAT is a network of congenital anomaly registries collecting data on live births, fetal deaths from 20 weeks’ gestation and TOPFA. Data from 29 registries in 19 countries were analysed for 2005–2009, and infant mortality (deaths of live births at age <1 year) compared with the WHO Mortality Database. Eight EUROCAT countries were excluded from further analysis on the basis that this comparison showed poor ascertainment of survival status.
Results According to WHO, 17%–42% of infant mortality was attributed to congenital anomaly. In 11 EUROCAT countries, average infant mortality with congenital anomaly was 1.1 per 1000 births, with higher rates where TOPFA is illegal (Malta 3.0, Ireland 2.1). The rate of stillbirths with congenital anomaly was 0.6 per 1000. The average TOPFA prevalence was 4.6 per 1000, nearly three times more prevalent than stillbirths and infant deaths combined. TOPFA also impacted on the prevalence of postneonatal survivors with non-lethal congenital anomaly.
Conclusions By excluding TOPFA and stillbirths from GBD years of life lost (YLL) estimates, GBD underestimates the burden of disease due to congenital anomaly, and thus declining YLL over time may obscure lack of progress in primary, secondary and tertiary prevention.
- Congenital anomaly
- mortality
- Global Burden of Disease
- YLL
- DALY
This is an Open Access article distributed in accordance with the Creative Commons Attribution Non Commercial (CC BY-NC 4.0) license, which permits others to distribute, remix, adapt, build upon this work non-commercially, and license their derivative works on different terms, provided the original work is properly cited and the use is non-commercial. See: http://creativecommons.org/licenses/by-nc/4.0/
Statistics from Altmetric.com
What is already known on this topic?
Global Burden of Disease (GBD) estimates of years of life lost due to congenital anomaly have been declining over time worldwide.
GBD estimates include only live births.
It is difficult to obtain accurate cause of death data from death certificates for infant and child deaths.
What this study adds?
EUROCAT data (2005–2009) show terminations of pregnancy for congenital anomaly were almost three times more frequent than infant deaths and stillbirths with congenital anomaly combined.
In countries where termination of pregnancy is illegal, the rate of infant mortality with congenital anomaly is higher than in other European countries.
Ignoring termination of pregnancy and stillbirth underestimates the GBD associated with congenital anomaly and obscures lack of progress in primary, secondary and tertiary prevention.
Introduction
According to the 2010 Global Burden of Disease (GBD) study,1 2 congenital anomalies accounted for 510 400 deaths worldwide in 2010, 1% of all deaths (6% of neonatal and postneonatal infant deaths, 2.5% of deaths 1–4 years), ranking 23rd among all causes of death.1 Since deaths due to congenital anomaly tend to be very early in life,3 the burden in years of life lost (YLL) is higher — congenital anomaly ranked 14th among causes of death.1
The GBD estimates were based on the WHO Mortality Database,4 for which death certification is the major data source. For low-income/middle-income countries, they are likely to be underestimated due to the absence of accurate cause of death data5 6 — Modell et al have calculated that mortality due to congenital anomaly for the under-5 age group is likely to be a fourfold underestimation,6 and have proposed that better mortality estimates would be produced by combining prevalence estimates with estimated survival in different healthcare systems. Further caveats in interpreting GBD statistics for congenital anomaly are that stillbirths and terminations of pregnancy for fetal anomaly (TOPFA) after prenatal diagnosis are not counted among deaths. The practice of civil registration of perinatal deaths due to severe or lethal congenital anomaly as stillbirths or very early neonatal deaths can vary in time and place due to differences in registration practices7 and in resuscitation practices at the edge8 of viability.8–10 Thus it is illogical to count deaths in the first week of life in GBD, but not stillbirths.
EUROCAT is a network of population-based congenital anomaly registries in Europe covering approximately 30% of the European Union (EU) birth population as well as some non-EU countries. Prevalence data11 are based on a well-validated, harmonised system.12 The aims of this paper are to compare infant mortality data collected by EUROCAT registries with that provided in the WHO Mortality Database, and to discuss the significance of stillbirths and TOPFA in the interpretation of infant mortality statistics. In Europe, TOPFA is legal in all countries represented in EUROCAT, except Ireland and Malta.
Methods
The EUROCAT central database contains standard data on congenital anomaly cases from population-based congenital anomaly registries.12–14 Cases include live births, fetal deaths from 20 weeks’ gestation (including stillbirths) and TOPFA (of any gestational age). Survival (yes/no) to 1 week (days 0–6) is recorded for all liveborn cases by all registries. Age at death (in days) is also available for 29 registries in 19 countries, at least up to age 1 year, but may not be complete as many registries do not have access to death certificates.13 These 29 registries include two associate registries (Finland and Sweden), which provided aggregate data regarding survival but do not contribute individual data to the central database. In the 19 countries, 3%–100% of national births are covered by EUROCAT registries (table 1).
Death from congenital anomaly (CA) in the first year of life (infant deaths), comparing EUROCAT data with that reported by WHO per country for selected years 2005–2009*
For ascertainment of survival, 9 out of 29 registries have systematic access to death certificates (table 1); 9 have systematic access to hospital notes up to at least 1 year; 2 registries have systematic access to hospital notes up to 1 week or discharge; and 8 out of 29 have no systematic data source.
The WHO Mortality Database4 includes the total number of deaths under 1 year (infant deaths) by cause of death. Stillbirths are not included. Numbers of all infant deaths and infant deaths due to congenital anomaly were downloaded for the years 2005–2009, by country, for all countries participating in EUROCAT (table 1). The population for which both WHO and EUROCAT data were available (at the time of download) comprised 2715 012 live births. Infant mortality recorded by EUROCAT is slightly differently defined — deaths of registered cases are recorded, but the cause of death (which is not recorded) may occasionally not be related to the congenital anomaly, and we therefore refer to this as ‘deaths of infants with congenital anomaly’.
WHO rates per 1000 births of ‘infant death/mortality due to congenital anomaly’ for the entire country were compared with EUROCAT rates per 1000 births of ‘infant death/mortality with congenital anomaly’ for the portion of the country covered by EUROCAT. WHO data are based on year of death while EUROCAT data are based on year of birth. The comparison (and all further analyses of EUROCAT data) was based on years (of death/birth) present in both databases. There were 11 EUROCAT countries (19 registries) that recorded rates of infant mortality with congenital anomaly of 80% or more than the rate recorded by WHO (figure 1), thus indicating that coverage of deaths up to 1 year was reasonably complete. Data from 17 registries in 9 of these countries (ie, excluding Finland and Sweden) were included in further analyses of pregnancy outcome and age at death.
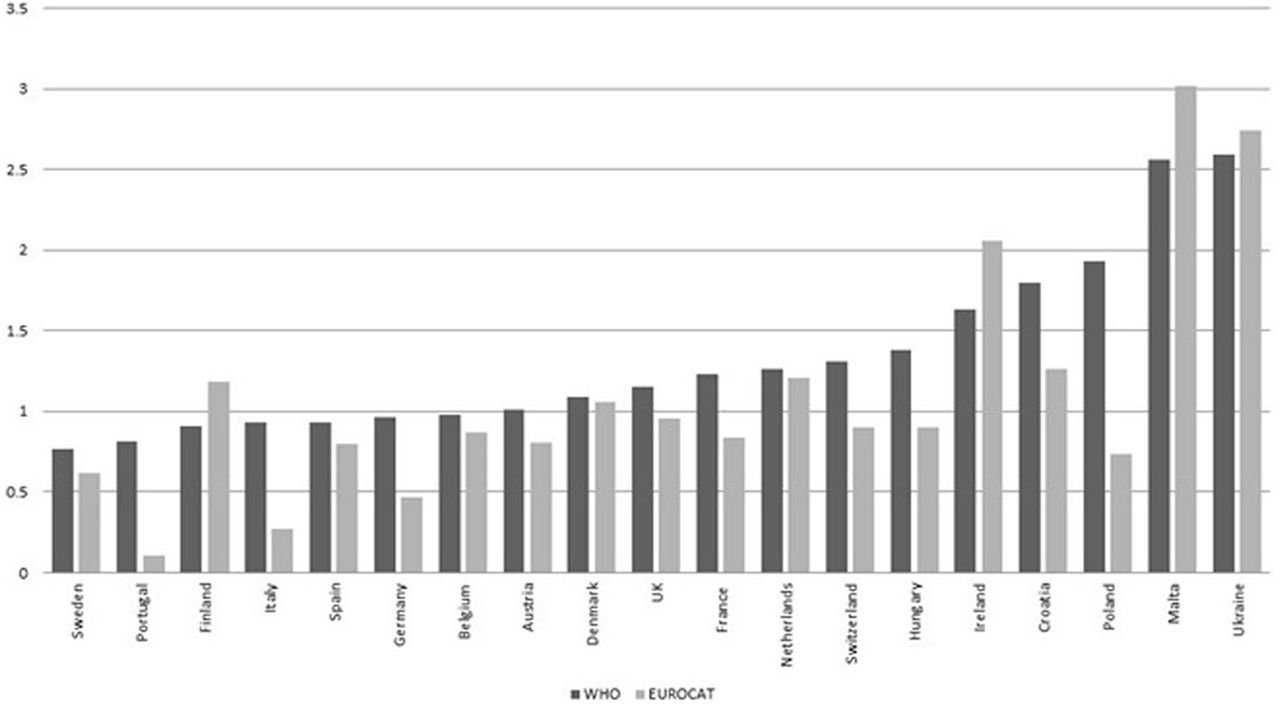
Prevalence per 1000 live births of infant deaths due to congenital anomaly (WHO) and infant deaths with congenital anomaly (EUROCAT) for 29 EUROCAT registries in 19 countries, 2005–2009. *Registries and years as stated in Table 1.
EUROCAT records all major congenital anomalies, excluding a specified list of minor anomalies and conditions that are poorly specified or related to immaturity at birth.12 Major congenital anomalies for this paper were classified into subgroups according to EUROCAT Guide 1.312 based on International Classificationf or Diseases (ICD) codes, further classified by isolated/multiply malformed/syndrome status according to the EUROCAT multiple malformation algorithm.15 For this paper, cases were also grouped according to chances of survival: lethal anomalies (anencephaly, bilateral renal agenesis, trisomy 13 and 18), anomalies associated with TOPFA (Down syndrome, spina bifida, analysed separately) and anomalies usually liveborn and requiring surgery16 17 (severe congenital heart defects, digestive system anomalies, abdominal wall defects, craniosynostosis and orofacial clefts).
Analyses included prevalence per 1000 births/live births of infant deaths with congenital anomaly, proportion of infant deaths among live births by age at death and prevalence of congenital anomaly cases from ‘all diagnosed cases’ including TOPFA, to all cases surviving to 20 weeks (ie, excluding TOPFA <20 weeks), to birth (live birth or stillbirth or late fetal death from 20 weeks’ gestation), to live birth, to age 1 week, 28 days and 1 year.
Perinatal death/mortality is here defined as all fetal deaths from 20 weeks’ gestation (including stillbirths) and first-week deaths, expressed per 1000 total births; infant mortality: deaths at age <1 year per 1000 live births; early neonatal mortality: first week deaths per 1000 live births; late neonatal mortality: deaths from 7 days to 27 days per 1000 live births; and postneonatal mortality: deaths from 1 month to 1 year per 1000 live births.
This research is in compliance with the Helsinki Declaration (http://www.wma.net/en/30publications/10policies/b3/index.html). Permission for the study as part of the EUROCAT project was granted by the Institute of Nursing and Health Research, School of Nursing Research Governance Filter Committee at Ulster University on behalf of the Ulster University Ethics Committee.
Results
According to the WHO data, 17%–43% of infant mortality was attributed to congenital anomaly, with higher attributable rates recorded in Malta (43%) and Ireland (42%) (table 1).
After excluding the eight EUROCAT countries with poor survival data (infant mortality with congenital anomaly more than 20% lower than recorded by WHO), there remained seven countries where EUROCAT estimates were between 80% and 100% of the WHO rate, in six of which some of the difference may be explained by geographical non-representativeness. In four countries, EUROCAT estimates were higher than WHO. The greatest differences were in Finland, where WHO mortality was 0.92 per 1000 but the EUROCAT estimate (with 100% national coverage) was 29% higher at 1.19 per 1000 (table 1), and Ireland, where WHO mortality was 1.63 but the EUROCAT estimate (with 62% national coverage) was 26% higher at 2.05 per 1000 (table 1). The average (EUROCAT) infant mortality with congenital anomaly in the 11 analysed countries was 1.1 per 1000 (figure 2).
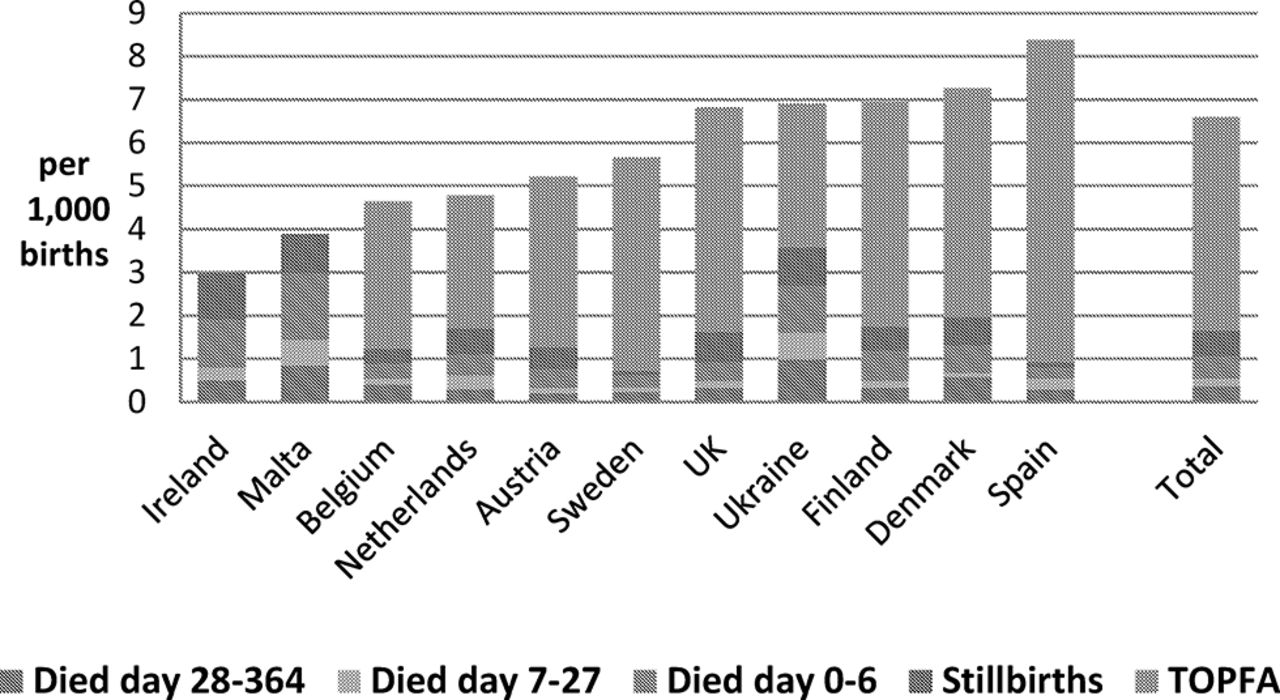
Prevalence per 1000 births of infant deaths with congenital anomaly, by age at death and country, for 19 EUROCAT registries in 11 countries, 2005–2009. *TOPFA, terminations of pregnancy for fetal anomaly. *Years as stated in Table 1. Eleven countries (19 EUROCAT Registries) which ascertain more than 80% of the infant mortality attributed to congenital anomaly recorded by WHO: Austria = Styria; Belgium = Antwerp and Hainaut; Denmark = Odense; Finland; Ireland =Dublin, SE Ireland and Cork & Kerry; Malta; Northern Netherlands; Spain = Basque Country, Sweden; UK= Wales, SW England, Wessex, Northern England, EMSYCAR and Thames Valley; Ukraine.
The average total prevalence of congenital anomaly cases (including live births, fetal deaths more than 20 weeks and TOPFA) in the 11 countries was 26.9 per 1000 births. Of these 77.0% were live births surviving infancy.
A total of 17% of congenital anomaly cases were TOPFA, or a prevalence of 4.6 per 1000 births (figure 2), varying from 0 (Malta) to 7.5 per 1000 (Spain-Basque Country) (figure 2). A total of 2.1% were stillbirths, a prevalence of 0.6 per 1000 births, also varying by country (figure 2). Early neonatal deaths accounted for 49% of all first-year deaths. The prevalence of perinatal deaths and infant deaths was higher in those countries where TOPFA is illegal (figure 2). In Ireland 10.6% of all congenital anomaly cases were perinatal deaths, and in Malta 8.9%. Ukraine differed from the other countries in having relatively high perinatal and infant mortality in spite of having a TOPFA rate at the lower end of the range (figure 2). Spain-Basque Country had the highest overall mortality (figure 2), most of this being due to TOPFA, and lowest perinatal mortality.
Overall, TOPFA was four times more common than infant deaths and nearly three times more common than all stillbirths and infant deaths combined (figure 2). Infant mortality was highest for multiply malformed live births (15% of cases) and lowest for cases with an isolated anomaly (nearly 4%, figure 3).
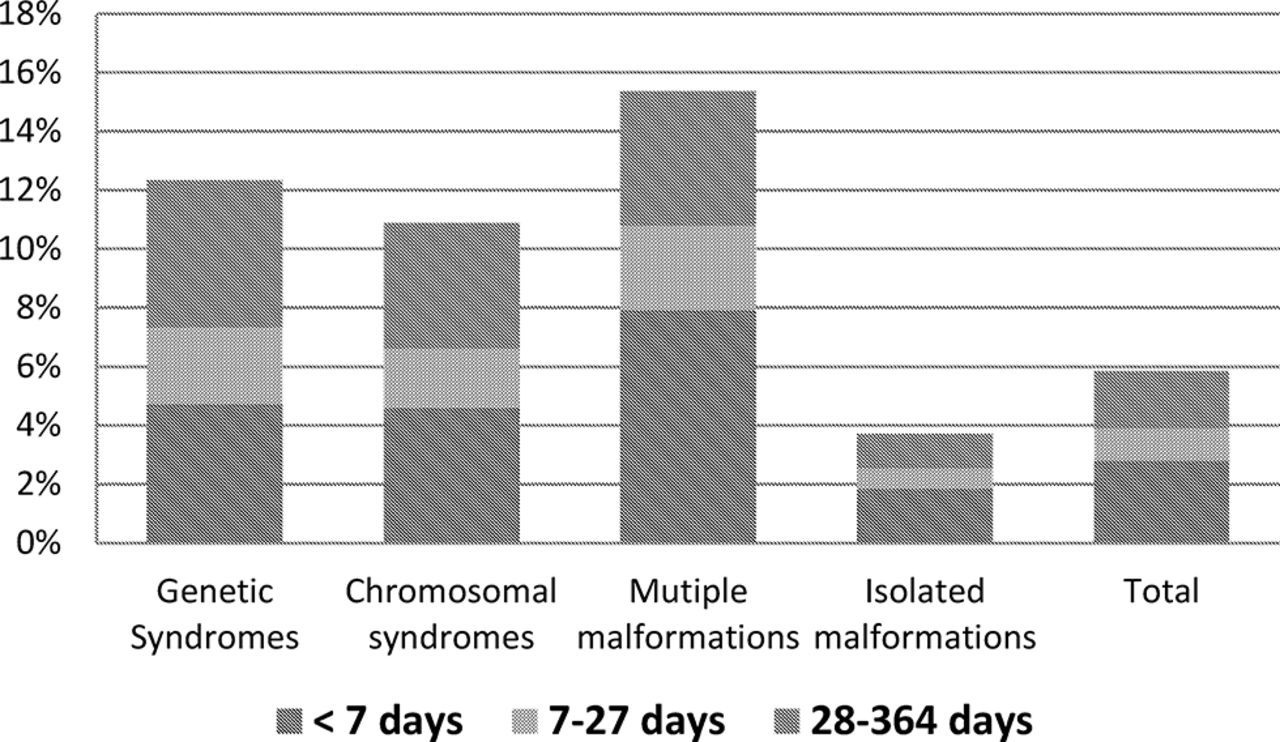
Proportion of infant deaths among live births with congenital anomaly, by age at death, and association with multiple malformations or syndromes, for 17 EUROCAT registries in nine countries, 2005–2009. *Years as stated in Table 1. Nine countries (17 full member EUROCAT registries) which ascertain more than 80% of the infant mortality attributed to congenital anomaly recorded by WHO: Austria = Styria; Belgium = Antwerp and Hainaut; Denmark = Odense; Ireland = Dublin, SE Ireland and Cork & Kerry; Spain = Basque Country; UK = Wales, SW England, Wessex, Northern England, EMSYCAR and Thames Valley; Ukraine. *Years as stated in Table 1.
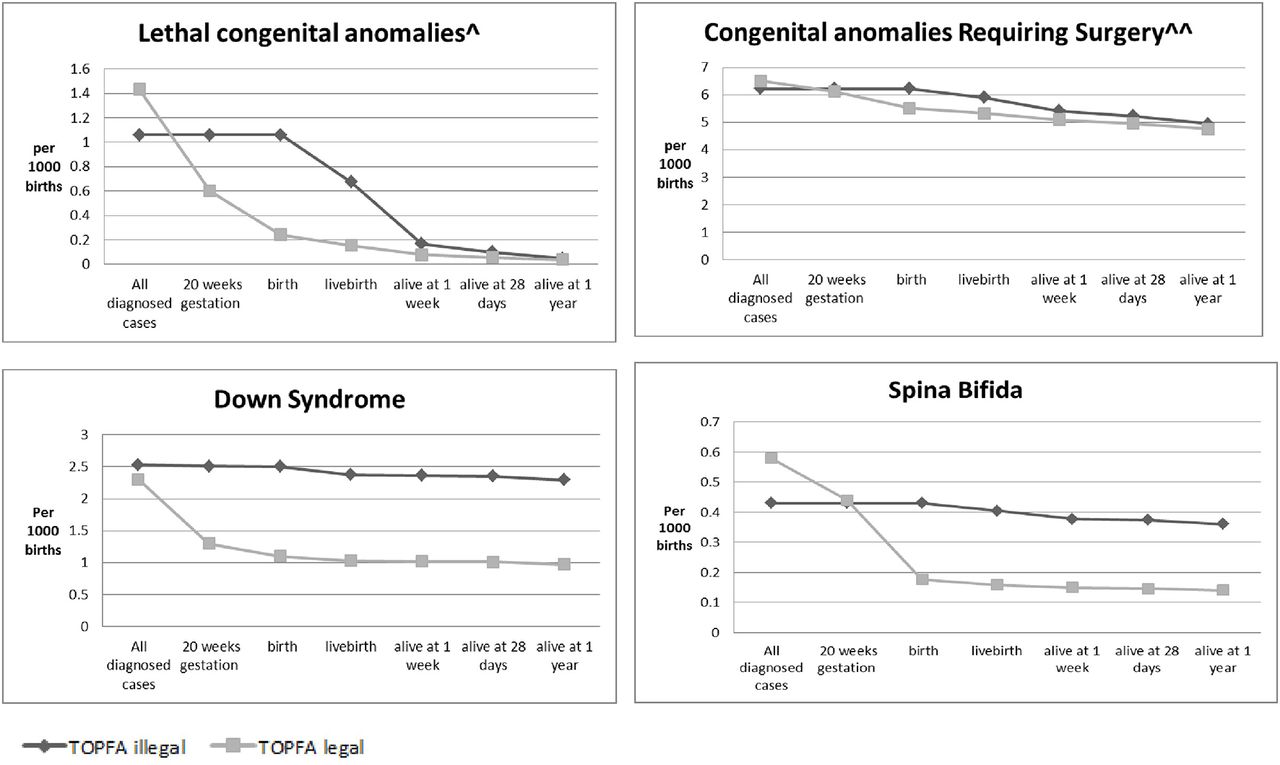
The survival pattern and prevalence of survivors at 1 year differs between countries where TOPFA is legal and illegal (figure 4). For lethal anomalies, the prevalence of survivors converges at 1 week of life between countries where TOPFA is legal and illegal (figure 4). For Down syndrome and spina bifida, where TOPFA is frequent but infant mortality is low, the difference between countries where TOPFA is legal and illegal is greatest and persists up to 1 year of life (figure 4). For congenital anomaly typically liveborn and requiring surgery, the survival pattern converges at 1 year of age in the two groups of countries (figure 4).

Prevalence of congenital anomaly cases per 1000 births, from before 20 weeks’ pregnancy up to 1 year of age, by legality of TOPFA* for lethal anomalies, Down syndrome, spina bifida, and surgically treated anomalies, for 17 EUROCAT registries in nine countries,** 2005–2009.*** *TOPFA is illegal in Malta and Ireland. **Nine countries (15 full EUROCAT registries) which ascertain more than 80% of the infant mortality attributed to congenital anomaly recorded by WHO: Austria = Styria; Belgium = Antwerp and Hainaut; Denmark = Odense; Ireland = Dublin, SE Ireland and Cork & Kerry; Malta; Northern Neterlands; Spain = Basque Country; UK = Wales, SW England, Wessex, Northern England, EMSYCAR and Thames Valley; Ukraine. ***years as stated in Table 1 ^Lethal anomalies are anencephaly, bilateral renal agenesis and trisomy 13 and 18^^Anomalies typically requiring surgery are: severe congenital heart defects, digestive system anomalies, abdominal wall defects, craniosynostosis and oro-facial clefts. See Public Health Indicators Khoshnood et al (8) all diagnosed cases” including TOPFA, to all cases surviving to 20 weeks (i.e. excluding TOPFA <20 weeks), to birth (livebirth or stillbirth or late fetal death from 20 weeks gestation), to livebirth, to age one week, 28 days and 1 year.
Among all TOPFAs, 42% were at 20 weeks’ gestational age or later, varying according to anomaly category (figure 4).
Thirty-five per cent of babies (live or still) with lethal anomalies were stillborn (figure 4), as against 4%–9% for the other categories (figure 4). Infants with lethal anomalies accounted for 16% of all recorded infant mortality with a congenital anomaly and infants with surgically treatable anomalies 52%.
Discussion
Infant mortality due to congenital anomaly in Europe, according to the WHO mortality data based on death certificates, ranges from one-fifth to two-fifths of infant deaths. Strategies to reduce infant mortality due to congenital anomaly are therefore an important part of meeting the millennium goals to reduce infant mortality18 and the sustainable development goals for 2030,19 and we need accurate and comprehensive data to monitor progress. We found that EUROCAT national estimates of infant mortality could be up to 29% higher than WHO estimates based on death certificates alone, assumed to be mainly cases where congenital anomaly had not been given as the primary cause of death on death certificates. On the other hand, we also found evidence of under-recording of mortality by some EUROCAT congenital anomaly registries that was unlikely to be explained by limitations of the extrapolation of regional to national data. Congenital anomaly registries should be adequately resourced for, and data protection legislation should allow, their role in establishing fundamental population health statistics.
EUROCAT data show that TOPFA is on average four times more frequent than infant deaths, and nearly three times more frequent than stillbirths and infant deaths combined. Infant mortality due to congenital anomaly in a country is higher when the prevalence of TOPFA is lower, and it follows that increases over time in the TOPFA rate would lower the infant mortality rate. There is a danger then that apparent improvements in infant mortality due to congenital anomaly (and associated YLL) in GBD estimates could, via exclusion of TOPFA, mask lack of progress in primary prevention,20 lack of improvement in tertiary prevention via surgery5 and/or lack of improvement in secondary prevention via early diagnosis (prenatally or postnatally), leading to more successful treatment.21 This may be leading to misinterpretation of GBD statistics, such as the fall in YLL between 1990 and 2010.1 2 In addition, the current GBD estimates omit any appropriate weighting of the disability associated with loss of wanted pregnancies.
In Europe in the last 30 years, little progress has been made towards primary prevention of congenital anomalies, and this has occasioned EUROCAT to issue recommendations to encourage integrated primary prevention policies.22 Although periconceptional folic acid is a known protective factor for neural tube defects, evidence to date shows that neural tube defect prevalence has not declined23 due to failure of public health policy and implementation. It has only been possible to bring this to light by including data on TOPFA in surveillance, showing that increases in TOPFA have led to decreases in live birth prevalence, but that there has been no overall change in total prevalence.23
The exclusion of stillbirths from GBD burden of disease estimates has the greatest impact for lethal congenital anomalies. We had too few data to examine differences in civil registration (recording the birth of a baby with lethal anomaly as live or still) between countries, but this is likely10 for sociocultural and health system reasons.
For conditions such as spina bifida and Down syndrome with low postnatal mortality,24 our data show an impact of TOPFA on the prevalence of survivors and thus on Disability Adjusted Life Year (DALYs)25 rather than on YLLs. Investment in health and social services should reflect the greater needs in countries with lower TOPFA rates.
For surgically treatable anomalies (selected indicator conditions excluding spina bifida16), we found that the prevalence of survivors converges at 1 year, indicating that TOPFAs concerns the more severe cases with higher risk of mortality. European infant mortality for these conditions was much less than described for low-income and middle-income countries,5 and given the importance of improving surgical treatment in these countries, we suggest that separate monitoring of surgically treatable congenital anomaly be undertaken. Prenatal diagnosis may also be improving outcomes for these conditions,26 for postnatal surgery and increasingly also fetal surgery. In Europe on average, these anomalies represent at least 52% of all infant deaths with congenital anomaly.
Higher infant mortality due to congenital anomaly should be expected in countries where TOPFA is illegal,27 and socioeconomic differences within countries may occur where prenatal diagnosis or TOPFA is linked to ability to pay.28 29 However, there are some problems in the interpretation of data. There is evidence that, in those countries where abortion is illegal, some women are travelling abroad for TOPFA.30 On the other hand, we slightly overestimated the impact of TOPFA on mortality, since some early TOPFA (of the 58% under 20 weeks’ gestation) may without intervention have resulted in a spontaneous abortion by 20 weeks. From 10 weeks’ gestation, 89% Down syndrome, 77% trisomy 18 and 73% of trisomy 13 are estimated to survive to 20 weeks’ gestation31 while survival is higher for non-chromosomal conditions and from later gestational ages.
The majority (77% in our data) of children with congenital anomalies in the developed world are liveborn and survive infancy often with significant disability and need for treatment and rehabilitative services. The full burden of disease requires assessment of DALYs.25 The validity of the disability weighting system for congenital anomalies32 used in GBD requires further examination.6 Almost all the DALYs currently attributed to congenital anomalies in GBD estimates are related to early death rather than disability.25
The strengths of this paper are the broad geographical coverage and the high quality of case data recorded, including all pregnancy outcomes (except miscarriages before 20 weeks) and well-validated diagnoses. We analysed mortality as prevalence per 1000 births rather than proportion of all congenital anomaly cases, because proportions can be affected by variable ascertainment of live births diagnosed after the early neonatal period. The main limitation of interpretation is extrapolation from regional registries to a national scale for comparison with the WHO estimates, where there may be economic, social or healthcare differences between regions.26 We classified a limited number of conditions as ‘lethal’, although this term has been criticised and its application found to be variable in the literature,32 and we found a small number of deaths later than 1 year among ‘lethal’ conditions. Our case categories were based on EUROCAT Public Health Indicators,16 which do not include all congenital anomalies and make certain case classification decisions, such as analysing spina bifida on its own rather than included in surgically treatable anomalies, which could affect comparability with other studies.
Conclusions
GBD currently only considers the deaths of liveborn congenital anomaly cases and excludes TOPFA and stillbirths. This underestimates the societal health impact. TOPFA distorts both YLL and DALY estimates. Awareness of these issues is crucial in interpreting changes in GBD estimates in relation to primary, secondary or tertiary prevention.
References
Footnotes
Contributors HD and BB defined the research question, designed the study and interpreted the analysis. BB and HD co-wrote the paper. BB prepared and analysed the data. M-CA, LA, IB, FB, MC-S, HEKdW, CMD, ED, MG, EG, MH, KK, AL-B, BM, CM, VN, AJN, MO, AQ-W, HR, JR, AnkR, AnnR, CR, DT, CV-D, DW, BW and NZ-Z provided data and commented on drafts.
Funding Executive Agency for Health and Consumers Grant Agreement: 2013 3307 UU (OG).
Competing interests None declared.
Ethics approval Ethical approval has been granted for the collection of these data.
Provenance and peer review Not commissioned; externally peer reviewed.
Linked Articles
- Fantoms